使用 Gradio 进行演示#
这个笔记本通过一个示例介绍了 Gradio 库,该库能够帮助您轻松创建演示界面。
对象检测界面#
在这个示例中,我们使用一个图像对象检测模型,该模型在包含 80 个类别的 COCO 数据集上进行了训练。 具体采用的是 Meta 开发的 DETR 模型(facebook/detr-resnet-50)。
实现过程#
首先,我们使用 Hugging Face 的 transformers 库来构建处理流程。
from PIL import Image
import matplotlib.pyplot as plt
from transformers import pipeline
import cv2
import numpy as np
/home/aquilae/anaconda3/envs/dev/lib/python3.11/site-packages/tqdm/auto.py:21: TqdmWarning: IProgress not found. Please update jupyter and ipywidgets. See https://ipywidgets.readthedocs.io/en/stable/user_install.html
  from .autonotebook import tqdm as notebook_tqdm
detector = pipeline("object-detection", "facebook/detr-resnet-50")
Some weights of the model checkpoint at facebook/detr-resnet-50 were not used when initializing DetrForObjectDetection: ['model.backbone.conv_encoder.model.layer1.0.downsample.1.num_batches_tracked', 'model.backbone.conv_encoder.model.layer2.0.downsample.1.num_batches_tracked', 'model.backbone.conv_encoder.model.layer3.0.downsample.1.num_batches_tracked', 'model.backbone.conv_encoder.model.layer4.0.downsample.1.num_batches_tracked']
- This IS expected if you are initializing DetrForObjectDetection from the checkpoint of a model trained on another task or with another architecture (e.g. initializing a BertForSequenceClassification model from a BertForPreTraining model).
- This IS NOT expected if you are initializing DetrForObjectDetection from the checkpoint of a model that you expect to be exactly identical (initializing a BertForSequenceClassification model from a BertForSequenceClassification model).
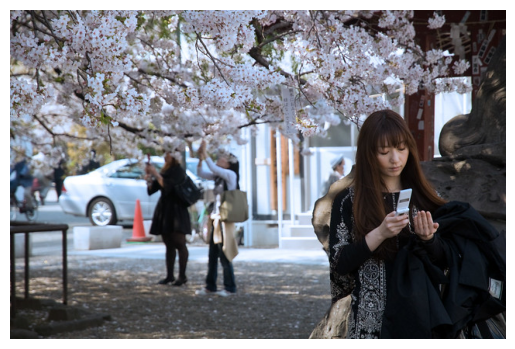
image = Image.open('images/coco3.jpg')
plt.imshow(image)
plt.axis('off')
plt.show()
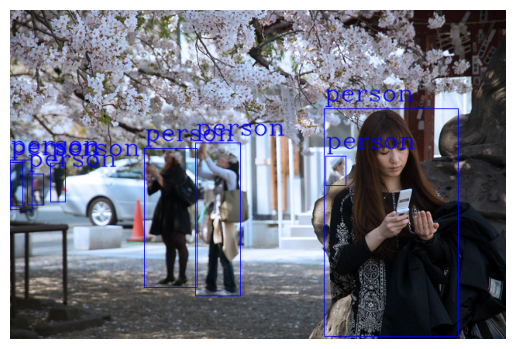
接下来进行对象检测并绘制边界框。为了保持结果清晰,我们仅标记图中的人。如果需要检测其他类别,可以移除此过滤条件。
def draw_boxes(image,output):
  cv_image = np.array(image)
  for bbox in output:
    box = bbox['box']
    label = bbox['label']
    if (label!="person"):
      continue
    cv2.rectangle(cv_image, (box['xmin'], box['ymin']), (box['xmax'], box['ymax']), (0, 0, 255), 1)
    cv2.putText(cv_image, label, (box['xmin'], box['ymin'] - 10), cv2.FONT_HERSHEY_COMPLEX, 1, (0, 0, 255), 1, cv2.LINE_AA)
  return cv_image

output = detector(image)
cv_image=draw_boxes(image,output)
plt.imshow(cv_image)
plt.axis('off')
plt.show()
Gradio 演示#
现在,我们将用 Gradio 构建一个演示界面。该界面的功能是:
输入:一张图片
输出:在同一张图片上标记出所有人的位置。
import gradio as gr
def get_pipeline_prediction(pil_image):
  pipeline_output = detector(pil_image)
  processed_image = draw_boxes(pil_image,pipeline_output)
  return processed_image
demo = gr.Interface(
  fn=get_pipeline_prediction,
  inputs=gr.Image(label="Image d'entrée",type="pil"),
  outputs=gr.Image(label="Image avec les personnes détectées",type="pil")
)
IMPORTANT: You are using gradio version 4.24.0, however version 4.29.0 is available, please upgrade.
--------
demo.launch()
Running on local URL:  http://127.0.0.1:7860

To create a public link, set `share=True` in `launch()`.
这样,您的自定义演示界面就完成了!
您可以通过在 launch() 方法中设置 share=True 参数来共享这个演示。但请注意:
共享期间需保持笔记本处于活动状态,否则演示将消失。
如果希望无需保持电脑开机也能运行演示,可在 Hugging Face 网站上创建一个 Space(详见笔记本 1)。
注意:Gradio 的功能远不止于此。 如果您有更多定制需求,可查阅: